1. The Flipped Classroom in general will most likely be new to all the future Math Analysis students. Even if you have experienced any type of Flipped Classroom, the one you will experience in Mrs. Kirch's class will be unlike anything you'll likely ever experience in terms of classroom environment. The way the classroom is set up is just very structured and wired for you to learn the material at home and complete work in class with the help of your teacher and peers. The best way to succeed in such a new system is to just be cooperative and follow the whole process of the system. The results will definitely show as long as you commit to the Flipped Classroom and keep yourself paced. Pacing is an important part of the Flipped Classroom as due dates aren't as definite and you will feel like you have a lot of work. However, if you keep yourself working, you will definitely master the material, with ease. I believe the Flipped Classroom is set up for you to succeed on your own. It is just that you are given many aids in order to help you master the material. It is up to you to succeed in Math Analysis, but it won't be that hard. It's just a matter of commitment and sticking to the system.
2. I think adjusting to the flipped classroom was kind of already addressed in my answer to question 1 as you do need to get used to the flipped classroom if you want to succeed in this class. There is absolutely no way you can completely reject the whole system and still manage to be successful. In terms of mastering the technology we use, it really is not that hard to learn how to use the technology. It really is self-explanatory. However, if you are not good with technology I suggest you get someone to help you at first because the flipped classroom requires A LOT of usage for technology. I don't have many tips or advice I can really offer up. However, you will have to make a lot of videos for this class and you do have a variety of options. If you have a camera with good quality you can do that. However, if you don't have a camera with good quality you should consider an alternative as it is best for Mrs. Kirch and your peers to understand and see your videos. If you have a microphone on your computer you can just open up Microsoft Paint, do the problem there, and record in on your computer with something like Bandicam or Camstudio. If you google these programs, you can download them on your computer and it won't be that hard to learn how to work. However, if you really are unable to understand these programs, I suggest just finding a camera of some sort. It all depends on if the quality of your video is good enough because that is very important.
3. Well, judging from my previous answers, it will be VERY different from any old math class. Instead of those dull boring lectures on math that generally puts a good amount of students to sleep, we just do work and get to interact with students. We are expected to work on our "homework" and ask help from Mrs. Kirch during class and watch the videos and do WSQ's at home, which is technically "classwork" because we learn at home. This doesn't necessarily mean we are all working hard during class as we do get a chance to interact with other students. Some free time is allowed every once in a while, but we are expected to utilize our time wisely and work on mastering the material in class that we just learned at home. Again, with the flipped classroom, the student is allowed a lot of freedom. Due dates are not as enforced and students are given time to themselves in class. However, it is all set up for the student to choose to succeed on their own, so always stay dedicated and committed to succeeding.
Wednesday, June 5, 2013

Unit V Big Question
Explain in detail where the formula for the difference quotient comes from now that you know! Include all appropriate terminology (secant line, tangent line, h/delta x, etc). Your post must include text and some form of media (picture/video) to support.
On a graph, we can draw a tangent line and a secant line. The secant line will touch the graph at two points whereas the tangent line will touch the graph at one point. The secant line is connected by two separate points on the graph. However, we do not know the exact distance so we call this delta x or h. We need to find the slope of the secant line using y sub 2-y sub 1/ x sub 2/ x sub 1. In terms of the values we give these points on the graph, we get (f(x)+deltax (or h) - f(x)/ x+deltax - x. Then, we can simplify this to get the difference quotient. http://www.millersville.edu/~bikenaga/calculus/mvt/mvt7.png

On a graph, we can draw a tangent line and a secant line. The secant line will touch the graph at two points whereas the tangent line will touch the graph at one point. The secant line is connected by two separate points on the graph. However, we do not know the exact distance so we call this delta x or h. We need to find the slope of the secant line using y sub 2-y sub 1/ x sub 2/ x sub 1. In terms of the values we give these points on the graph, we get (f(x)+deltax (or h) - f(x)/ x+deltax - x. Then, we can simplify this to get the difference quotient. http://www.millersville.edu/~bikenaga/calculus/mvt/mvt7.png
Wednesday, May 29, 2013
Unit U Big Question
1. What is a continuity? What is a discontinuity?
A continuous function is predictable and is void of any jumps, breaks, or holes in the graph. A graph with a continuity can be drawn without lifting one's pencil. Essentially, a discontinuity is anything that a continuity is not. It will appear to be a continuous function, but it will come with jumps, breaks, or holes in the middle of the graph. The 4 discontinuities are point and jump discontinuity and unbounded and oscillating behavior. For example, a point discontinuity will show a hole in the graph. Although the graph will mostly be continuous, the holes in the graph, meaning there is no y value at that x value on the graph, means that there is a discontinuity.
A Point Discontinuity: http://bfreshrize.files.wordpress.com/2012/01/unknown.jpeg?w=500


A continuous function is predictable and is void of any jumps, breaks, or holes in the graph. A graph with a continuity can be drawn without lifting one's pencil. Essentially, a discontinuity is anything that a continuity is not. It will appear to be a continuous function, but it will come with jumps, breaks, or holes in the middle of the graph. The 4 discontinuities are point and jump discontinuity and unbounded and oscillating behavior. For example, a point discontinuity will show a hole in the graph. Although the graph will mostly be continuous, the holes in the graph, meaning there is no y value at that x value on the graph, means that there is a discontinuity.
A Point Discontinuity: http://bfreshrize.files.wordpress.com/2012/01/unknown.jpeg?w=500
2. What is a limit? When does a limit exist? What is the difference between a limit and a value?
A limit is the intended height of the function at that x value. A limit will always exist as long as you reach the same point from both the left and right. Generally, a limit will always exist on the graph unless there is one of the 4 discontinuities at that point. The difference between a limit and a value is that a value is the actual height of the function rather than the intended.
The difference between a limit and a value can apply to point discontinuities like this one at x=2. The limit would be 2, but the value is 4. http://www.wyzant.com/Images/Help/disc1.gif
3. How do we evaluate limits numerically, graphically, and algebraically?
Numerically: This is when we evaluate the limit with a table, basically what we did in Concept 2. We will generally be given a function like f(x)=x^2. And then, we will be told to find the limit of f(x) as x approaches a number, like 2. So we set up a table to evaluate the limit. We will want to see what the y value is as x approaches 2. So we set up 1.9 and 1.99 from the left and 2.01 and 2.1 on the right. We plug in the function into our calculator, hit trace and input the x values to see what f(x) is as x approaches 2.
Graphically: We will put a finger to the left and to the right of where we want to evaluate the limit. We will then trace our fingers and see if they meet at a point. If they do, we have our limit, if not, the limit does not exist.
For example, for this graph: http://apcalckellyanderika.wikispaces.com/file/view/vert_asy.gif/206449186/vert_asy.gif, we trace our fingers and find that they do not meet. In fact, it approaches negative infinity from the left and infinity from the right. This is an example of unbounded behavior and a limit does not exist at x=3.
Algebraically: For the algebraic evaluation of limits, we have 4 methods. If we are searching for as x approaches infinity, we will divide everything by the highest value of x in the denominator. We should be able to simplify far enough to get a simpler answer. However, if x is approaching anything else we always start with direct substitution. For this, we just plug in our given number into x and hope we get a simple answer. However, if we get 0/0, this is indeterminate form and we must go to one of two methods. For the dividing out/factoring method, we use this when we see that we can factor the top and/or bottom and cancel something out. With the rationalizing/conjugate method, we will likely be multiplying something by its conjugate, most likely where we see a radical in the row.
Wednesday, April 24, 2013
Unit T Big Question 4
Sin and cos graphs are all either y/1 or x/1 in terms of ratios and this means that they will never have an asymptote for the denominator has to be 0 for the graph to be undefined. However all the other graphs, deal with sin/cos graphs in some manner. Csc= 1/sin, sec=1/cos, tan=sin/cos, cot=cos/sin. Therefore, if sin and cos graphs equal 0 in any place, there would be an asmyptote on another graph. For example, where a sin graph is 0, it is undefined and there is an asymtope on the csc and cot graphs.

This particular unit circle gives us the ordered pairs on the unit circle. With this, we can see where x and y is 0 and apply it to our knowledge of trig ratios.
Unit T Big Question 3
Tan and cot have the same ASTC, meaning that they are positive or negative in the exact same quadrants. However, they have asymtopes in different areas on the graph. The distance between two asymptotes on a tan/cot graph is 1 period. This is relevant to the explanation why a normal graph of each is differing from how they look. For tan, the asymptotes are at pi/2 (0,1) and 3pi/2 (0,-1) because it is sin/cos and since cos will be 0 here, the graph is undefined there. In one period, the quadrant between pi/2 and pi (Quadrant 2) is negative and from pi to 3pi/2 (Quadrant 3) it is positive so the graph itself is uphill. For cot, (cos/sin), the asymptotes are at 0 (1,0) and pi (-1, 0) because you then need sin to be 0 to get undefined. In a period for a cot graph, we are going from 0 to pi/2 (Quadrant 1) and from pi/2 to pi (Quadrant 2), so the graph starts positive and goes negative.
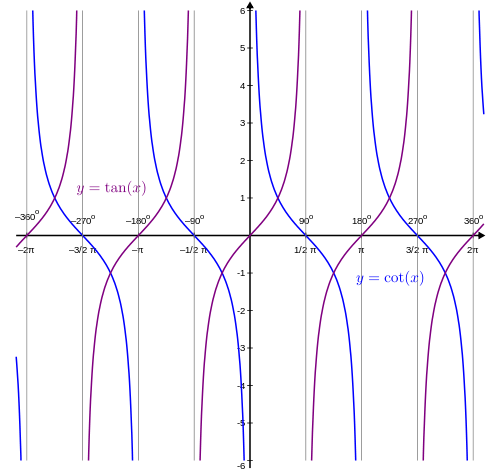 This graph clearly shows that tan and cot graphs are go in different directions. However, you can notice that the two graphs don't exactly follow the same period. Tan goes from quadrant 2 to quadrant 3 and cot goes from quadrant 1 to quadrant 2.
picture from: http://upload.wikimedia.org/wikipedia/commons/thumb/c/cf/Tan-cotan_proportional.svg/500px-Tan-cotan_proportional.svg.png
picture from: http://upload.wikimedia.org/wikipedia/commons/thumb/c/cf/Tan-cotan_proportional.svg/500px-Tan-cotan_proportional.svg.png
Unit T Big Question 2
Tan is a relation of sin over cos. This means that where cos=0, there is an asymptote on the tan graph. In contrast, if the any parts of the sin graph equals 0, the tan graph should be 0 there as well.
Cot is the relation of cos over sin. Where sin=0, there is an asymptote because the denominator is 0, making the graph undefined there. Whereas, if cos=0, then the cot graph would be 0 there as well.
Sec is the inverse of cos. So where cos=0, there is an asymptote, as the trig ratio is 1/cos. The graph will generally follow the guidelines of its inverse, but it has to include it flipped over and the presence of asymptotes.
Csc is the inverse of sin. Therefore, the trig ratio is 1/sin and there is an asymptote where sin=0. Again, this graph follows the guide of its inverse as well. It should look like the parent sin graph flipped in each region, separated by asymptotes.
 Given these two sin/cos parent graphs, we can use their values to help us graph the other types of graphs, even the tan/cot graphs as they are essentially just a relation of the two graphs.
Cot is the relation of cos over sin. Where sin=0, there is an asymptote because the denominator is 0, making the graph undefined there. Whereas, if cos=0, then the cot graph would be 0 there as well.
Sec is the inverse of cos. So where cos=0, there is an asymptote, as the trig ratio is 1/cos. The graph will generally follow the guidelines of its inverse, but it has to include it flipped over and the presence of asymptotes.
Csc is the inverse of sin. Therefore, the trig ratio is 1/sin and there is an asymptote where sin=0. Again, this graph follows the guide of its inverse as well. It should look like the parent sin graph flipped in each region, separated by asymptotes.
 Given these two sin/cos parent graphs, we can use their values to help us graph the other types of graphs, even the tan/cot graphs as they are essentially just a relation of the two graphs.
Unit T Big Question 1
The pattern for sin/cos is 2 positive and 2 negative in one period. The period itself is 2pi because the pattern repeats itself after going through 2pi. The period for tan/cot is just pi because the pattern is positive, negative and repeat. It only takes half the unit circle for the pattern to complete, so the pattern repeats itself ever half revolution of the unit circle.
The reasons for only sin and cos having amplitudes (of one) is that sin and cos are both limited by the x and y values of the graph. The lowest and highest values of x and y for either sin and cos is -1 and 1. The other graphs can have relations between x and y or be an inverse of sin/cos. Therefore, there really is no defined value like 1 or -1 that can be given to an amplitude. The other trig functions are not nearly as limited/defined by the x and y values of the unit circle.
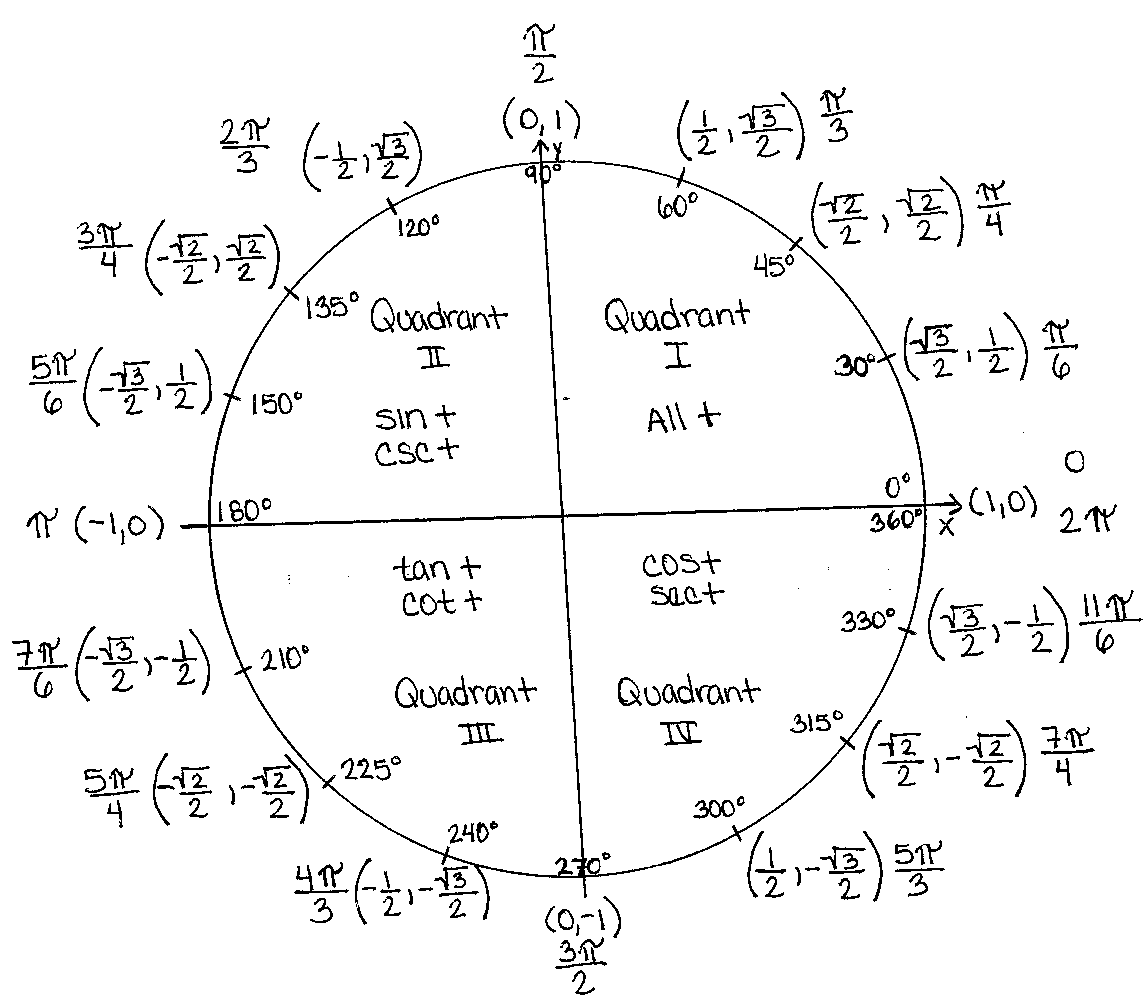 This particular unit circle can assist us in that it tells us in which quadrants the trig functions are positive or negative in. Also, the x and y values are on display here.
picture from: http://i7.photobucket.com/albums/y269/anime_firelight/unit20circle20measures20001.gif
The reasons for only sin and cos having amplitudes (of one) is that sin and cos are both limited by the x and y values of the graph. The lowest and highest values of x and y for either sin and cos is -1 and 1. The other graphs can have relations between x and y or be an inverse of sin/cos. Therefore, there really is no defined value like 1 or -1 that can be given to an amplitude. The other trig functions are not nearly as limited/defined by the x and y values of the unit circle.
picture from: http://i7.photobucket.com/albums/y269/anime_firelight/unit20circle20measures20001.gif
Subscribe to:
Posts (Atom)